This page provides a small example of the process of creating a cartogram using the software provided on the site. The intent is to let the reader decide if they are actually interested in trying to use the tools, or if they would prefer something more GUI-like (see the "Links" page for free GUI tools, among other things).
Two different input files are required to generate a cartogram
using these tools.
The first input file provides data about the theme variable that
the cartogram will represent –
in this case,
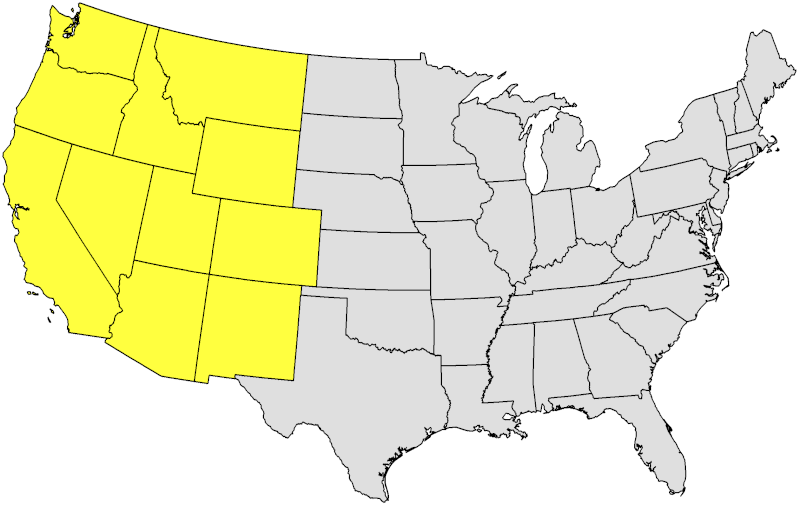
federal land holdings.
Each line in the data file consists of two, three, or four values
seperated by white space.
The first value on the line identifies the name of a subdivision,
eg,
"AL" represents Alabama.
Internally,
the software uses FIPS codes;
"AL" will be converted to the FIPS code "01" whenever the file is read.
Following the name are one or two numeric values that
define a "density" for the named subdivision
based on the variable that is being mapped.
If there are two numbers,
the first is the area of the subdivision and
the other value is the value of the variable for that subdivision.
If there is only one number,
it is assumed to be a precomputed density value.
The optional last value is a color to be used for the interior of the polygon
representing the subdivision.
Some common named colors are recognized.
Colors can always be designated in the RGB format "num,num,num"
where num is a value between 0 and 255.
If no color is specified,
the named color "gray" is used.
The first several lines of the file containing the data for
the federal land holdings cartogram
is shown at the end of this paragraph.
The single numeric value is the percentage of the state's area
owned by the federal government.
That value is already a density:
it's units are square miles per square mile
(then scaled up by 100).
AL     1.6    gray
AR     7.2    gray
AZ    48.1    yellow
CA    45.3    yellow
CO    36.6    yellow
The second file is a map file.
The file contains descriptions of the outline of named subdivisions
such as a collection of states or counties.
For each named subdivision there are
one or more polygons that define the outline of the subdivision.
The simple format consists of
one line with a name,
then one or more polygons.
Each polygon consists of a line containing only a "{" character,
then a sequence of (x,y) coordinate pairs,
one per line,
then a line containing only a "}" character.
Some entities will include more than one polygon.
For example,
the upper and lower peninsulas of Michigan are two completely distinct polygons.
Some polygons require lots of points to define and
some are much simpler.
At low resolutions,
Colorado is a rectangular state that can be described
by its four corners
in a particular coordinate space.
Note that the first and last points in the list are the same,
closing the polygon.
CO
{
  380.03    320.96
  384.94    234.64
  271.55    222.00
  259.33    309.93
  380.03    320.96
}
Subdivisions included in the map file
that do not appear in the data file
will be discarded.
The software and data included at this site
can generate fairly detailed state and county maps "on the fly".
Given map and data files
(and assuming the necessary software has been installed),
generating a cartogram is a matter of running the script.
Invoking the script will produce output like that shown here.
The progress bars will fill in as the activities they represent are performed.
The resulting cartogram will be stored as a PNG image in the file cartogram.png
which can be scaled or trimmed as necessary using any suitable software.
(I use the NetPBM package, which has been around forever, for command-line work.)
It may no longer be possible to produce exactly this listing
because of ongoing changes to the script code.
$ perl cartogram.pl -data holdings.data -map states.map -scale 2.5 -thick 4
Tag            Value
================================
Progress       first pass over data file
Progress       collected 48 identifiers
Progress       first pass over map file
Warning        unrecognized identifier 11
Progress       recognized 48 identifiers
Progress       bounding box -2366560.650000 -774638.550000 2223608.200000 2114380.510000
Progress       setting up graphics environment
Image scale    0.000544642273889336
Progress       bounding box -1288.92897371303 -421.900901314338 1211.07102628697 1151.58100883369
Image parms    2521 1594 1298 431
Progress       second pass over data file
Progress       second pass over map file
  100%  |==================================================|
Progress       third pass over map file
  100%  |==================================================|
$
The program invocation and trace tells us a bunch of things:
- The main script is written in Perl. The script invokes various open-source libraries and programs written in C and C++. Some of them may be available through your platform's package manager: for example, the MacPorts project for MacOS has prebuilt versions of all of them.
- The main script is invoked from the command-line. There are lots of options. Options can be read from a file instead of typed out repeatedly.
- The warning "unrecognized identifier 11" implies a couple of things. First, the map file contains an identifier that was not included in the data file. As noted above, that map object will be ignored. Second, the software tries to use state and county FIPS (Federal Information Processing Standard) codes internally. Code "11" is the District of Columbia.
- Informational numbers are printed to ridiculous precisions. Note, however, that the software uses numbers that differ by many orders of magnitude, which can occasionally lead to rounding errors.
- The presence of progress bars suggests that some steps in the process require lots of time. A couple of them are likely to involve waiting for minutes on typical PC hardware. It is possible to ask for things that take hours to finish.
If any of those bother you, this is probably not the right software for you. The default map type is "flat". The above invocation generated this map:
Next: Links
Last updated Feb 23, 2018